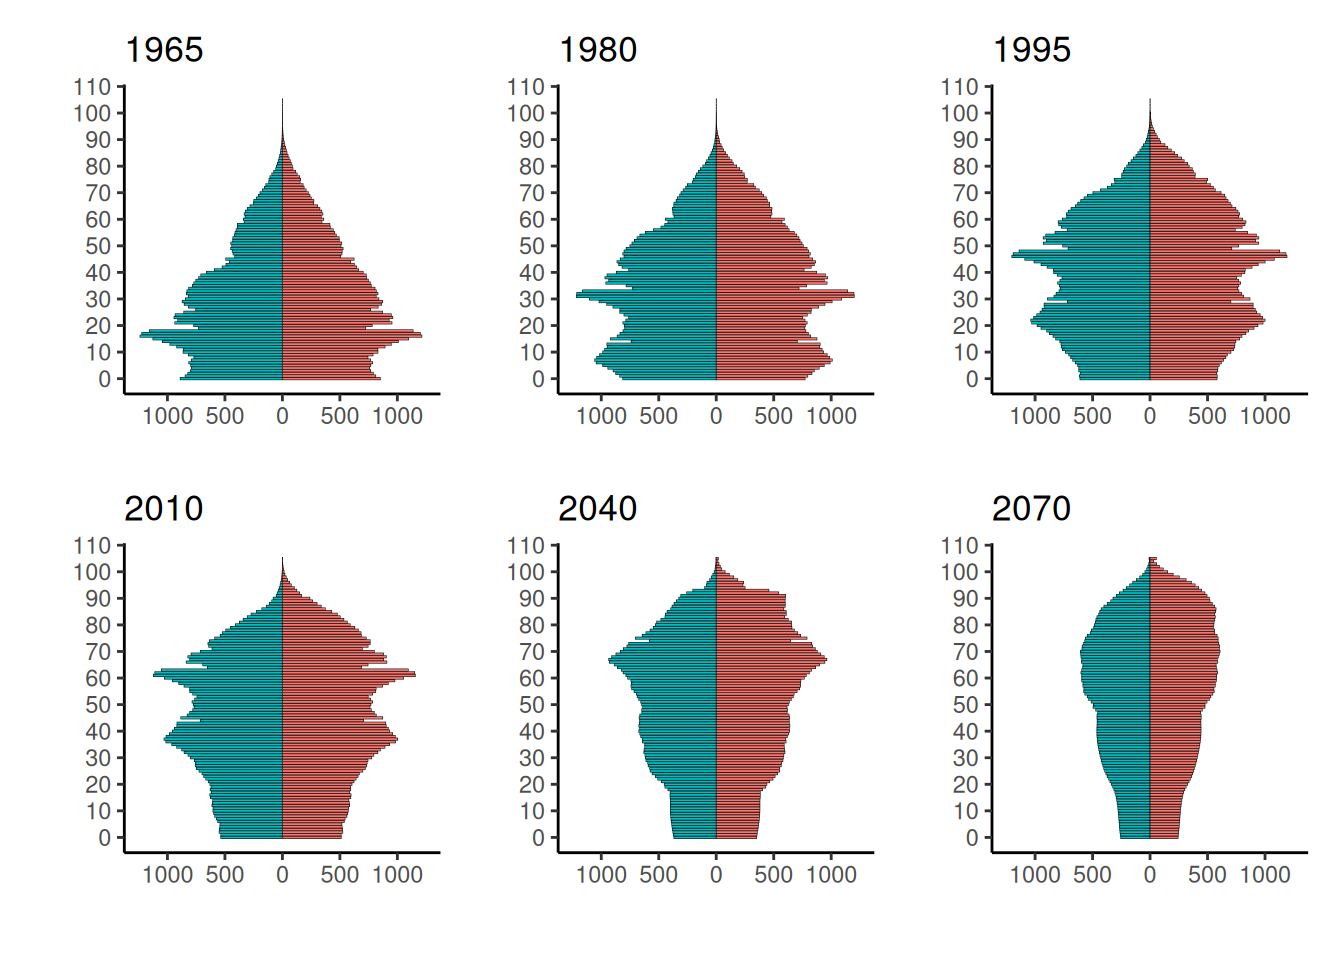
概要
人口プラミッドの推移を描く。データは国立社会保障・人口問題研究所のホームページから取得(1965年から2070年の予測まで,Excelファイルで提供されている)。
- 人口ピラミッドの作り方については,人口ピラミッドの作成 (2020年国勢調査)を参照。
- 複数年の人口ピラミッドのグラフをきれいに並べるために,patchworkパッケージを使う。
コードと実行結果
library(tidyverse)
library(patchwork)
library(readxl)

# グラフのテーマ
theme_set(theme_classic(base_family = "IPAexGothic", base_size = 16))

# ファイルのダウンロード先ディレクトリ作成
dir.create("files", showWarnings = F)

# 国立社会保障・人口問題研究所のホームページからデータをダウンロード
download.file(
  "https://www.ipss.go.jp/site-ad/TopPageData/pyramidDataPP2023J_11.xlsx",
  destfile = "files/pyramidDataPP2023J_11.xlsx",
  method = "curl"
)

# データの整理 年,年齢階級,性別,人口のlong形式に
male <- read_excel(
  "files/pyramidDataPP2023J_11.xlsx",
  sheet = "M",
  range = "B3:W110",
  col_names = TRUE
)

female <- read_excel(
  "files/pyramidDataPP2023J_11.xlsx",
  sheet = "F",
  range = "B3:W110",
  col_names = TRUE
)

age <- c("total", 0:105)

male <- cbind(age, male) |>
  pivot_longer(- age, names_to = c("year")) |>
  filter(age != "total") |>
  mutate(
    gender = "M",
    age = as.numeric(age),
    value = -value
  )

female <- cbind(age, female) |>
  pivot_longer(- age, names_to = c("year")) |>
  filter(age != "total") |>
  mutate(
    gender = "F",
    age = as.numeric(age)
  )

population <- rbind(male, female)

# 人口ピラミッドを作成する年を指定
years <- c(1965, 1980, 1995, 2010, 2040, 2070)


# 人口ピラミッドの描画
for (i in years) {
  fig <- population |>
    filter(year == i) |>
    ggplot(aes(x = age, y = value, fill = gender)) +
    geom_bar(stat = "identity", color = "black", linewidth = 0.1) +
    scale_x_continuous(n.breaks = 10) +
    scale_y_continuous(
      limits = c(-1250, 1250),
      breaks = seq(-1000, 1000, 500),
      labels = abs(seq(-1000, 1000, 500))
    ) +
    scale_fill_hue(
      name = "",
      labels = c("F" = "女", "M" = "男")
    ) +
    labs(title = i, y = "", x = "") +
    coord_flip() +
    theme_classic() +
    theme(legend.position = "none")

  if (i == years[1]) {
    g <- fig
  } else {
    g <- g + fig
  }
}

plot(g)